¡ESTAMOS ABIERTOS TODO EL VERANO! HAZ TU PEDIDO. ☀️
Más
Tipo de imagen


25 50 75 100
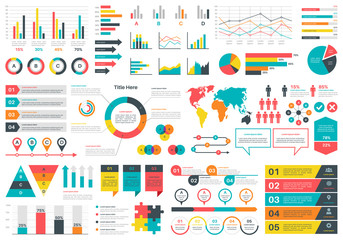
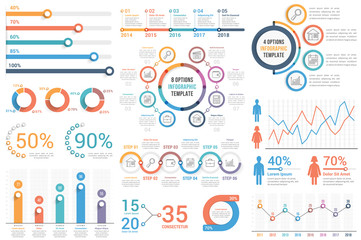
  • #308401567 Infographics charts. Financial analysis data graphs and diagram, marketing statistic workflow modern business presentation elements vector set
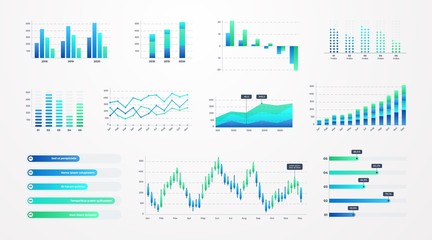
  • #325159519 Histogram charts. Business infographic template with stock diagrams and statistic bars, line graphs and charts for presentation and finance report. Vector set charting on dashboard
  • #437767608 infographics collection
  • #236669676 Presentation Template design. Business data graphs. Vector financial and marketing charts.
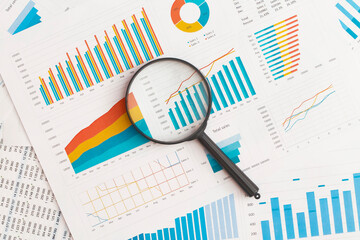
  • #458419120 Business graphs, charts and magnifying glass on table. Financial development, Banking Account, Statistics
  • #258577237 Editable Infographic Templates. Use in corporate report, marketing, annual report. Network management data screen with charts, diagrams. Hud vector interface
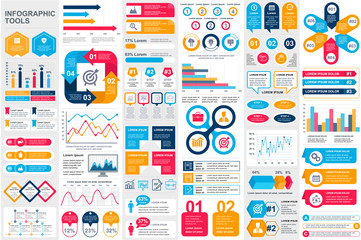
  • #274731835 Set of infographic elements data visualization vector design template. Can be used for steps, options, business process, workflow, diagram, flowchart concept, timeline, marketing icons, info graphics.
  • #1364569267 Various colorful data visualization charts and graphs in modern style on a dark background. Concept of business analytics and statistics. Vector illustration
  • #603222927 set of colorful dark cool pie chart, visual chart
  • #127542566 Many charts and graphs. Reflection light and flare. Concept image of data gathering and statistical working.
  • #242020648 Stock market or forex trading graph in graphic concept
  • #321695743 Business infographic. Organization chart with 4 options. Vector template.
  • #180534198 Infographic Elements
  • #203803910 grafico economia, istogrammi, statistiche
  • #921160503 Business financial chart with uptrend line graph and world map on blue color background
  • #377886528 Multi exposure of virtual creative financial chart hologram on empty modern office background, research and analytics concept
  • #747559603 Professionals explore complex data analytics displayed on digital tablet, highlighting modern business strategy and decision-making. Business and latest analysis technologies
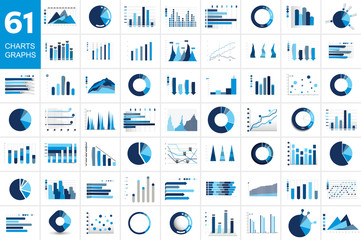
  • #313477524 Mega set of charst, graphs. Blue color. Infographics business elements.
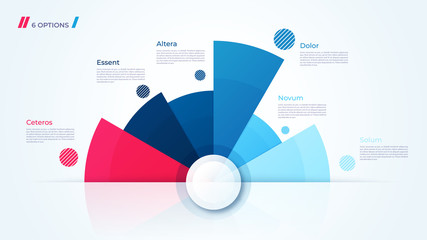
  • #223755541 Vector circle chart design, template for creating infographics
  • #595013094 Futuristic raise arrow chart digital transformation abstract technology background. Big data and business growth currency stock and investment economy. Vector illustration
  • #441320165 Market chart of business increase stock graph or investment financial data profit on growth money diagram background with success diagram exchange information.
  • #1412888539 Transparent or png stock market investment trading graph growth.Trade business analytics graph and financial chart.Business trade analytics line graphs and financial chart investment. PNG chart.
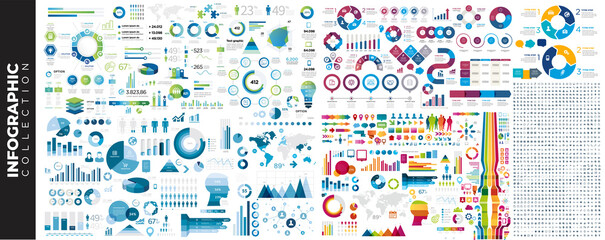
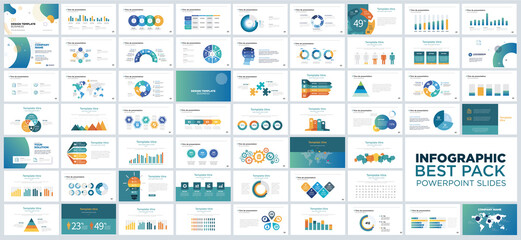
  • #469106231 Full pack infograpic collection
  • #439569482 Modern infographic template with stock diagrams and statistics bars, line graphs and charts for finance report. Diagram template and chart graph,UI and UX Kit with big data visualization. Vector
  • #457365862 Business graphs, charts and magnifying glass on table. Financial development, Banking Account, Statistics
  • #600977965 Perspective view of stock market growth, business investing and data concept with digital financial chart graphs, diagrams and indicators on dark blue blurry background. 3D rendering
  • #303135029 Bundle infographic elements data visualization vector design template. Can be used for steps, business processes, workflow, diagram, flowchart concept, timeline, marketing icons, info graphics.
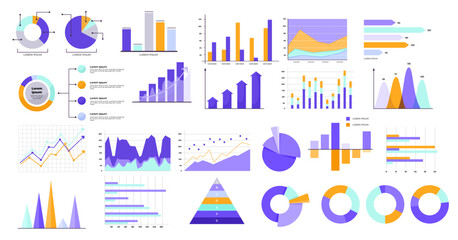
  • #1132603145 Collection of colorful charts and graphs, including bar, line, pie, and pyramid graphs, on a white background. Data visualization concept. Vector illustration.
  • #203669387 financial graphs background
  • #127542029 Many charts and graphs. Reflection light and flare. Concept image of data gathering and statistical working.
  • #1241666997 A dynamic visualization of financial market data. Candlestick charts illustrate stock price fluctuations, showcasing upward trends and potential investment growth opportunities. Data analysis tools ar
  • #314262547 Abstract polygonal backgrounds with stripy triangles and 3D cubes vector designs set. Templates for different advertising or covers or banners. Retro style graphic elements.
  • #1327207109 Close up of stock market data displayed on a digital screen with fluctuating graphs and charts : Generative AI
  • #650794780 Representation of data analytics,charts, graphs and data driven insights emerging from a sea of information
  • #299978128 Closeup financial chart with uptrend line candlestick graph in stock market on blue color monitor background
  • #1177898270 Green arrow pointing upward on financial graph. Business growth chart with rising trend line. Digital stock market data visualization for investment analysis
  • #316776050 Geometric abstract elements memphis style. Set of funky bold constructivism graphics for posters, flyers. Vector yellow and black minimal shapes for modern cover design
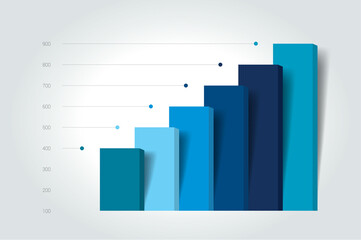
  • #366560615 Chart, column graph, infographic element.
  • #760150631 Abstract glowing big data forex candlestick chart on blurry city backdrop. Trade, technology, investment and analysis concept
  • #291747568 Business candle stick graph chart of stock market investment trading on blue background. Bullish point, Trend of graph. Eps10 Vector illustration.
  • #409689073 Concept of stock market and fintech forex concept. Blurry blue digital charts over dark blue background. Futuristic financial interface. 3d render illustration.
  • #573426786 Brutalist abstract geometric shapes and grids. Brutal contemporary figure star oval spiral flower and other primitive elements. Swiss design aesthetic. Bauhaus memphis design.
  • #495536308 infographic template
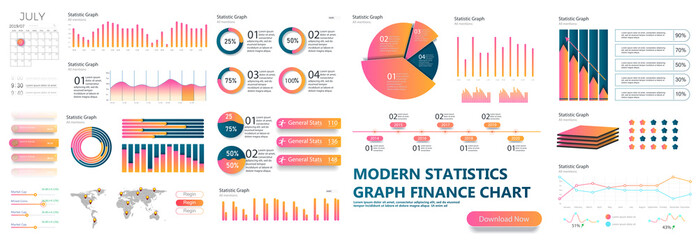
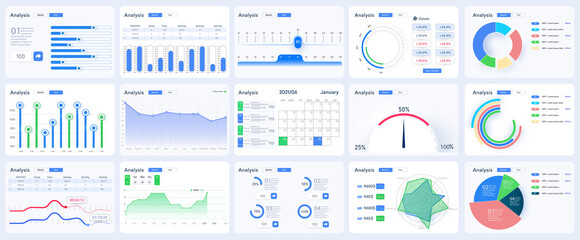
  • #274013253 Modern infographic template with statistics finance charts. Infographics dashboard. Admin panel interface with color charts, graphs, calendar and charts on a white background. Vector illustration
  • #425514769 Business graphs and charts icons. Business infographics icons. Statistic and data, charts diagrams, money, down or up arrow, economy reduction. Financial chart. Vector illustration.
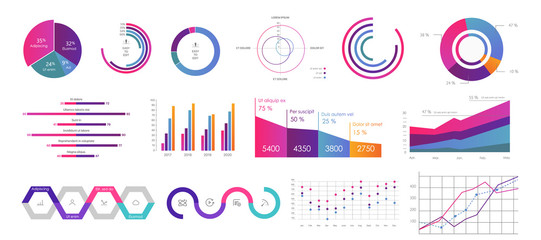
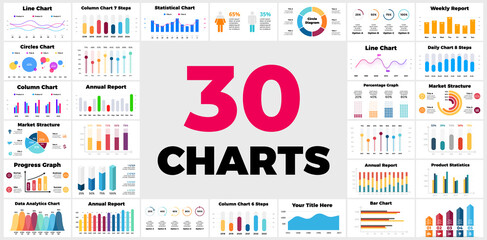
  • #415820699 30 Infographics. Column, bar, line charts. Business financial reports. Marketing structure. Daily, weekly, annual statistics. Circle diagrams. Percentage graph. Presentation template.
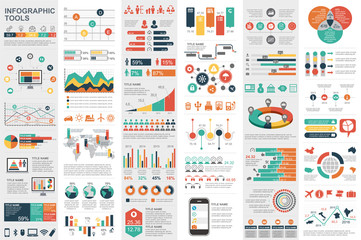
  • #133797356 Infographic elements data visualization vector
  • #996635414 A tablet displaying colorful graphs and charts alongside printed reports on a table.
  • #1309926513 Closeup of a businessman s hand touching and analyzing financial market trends and analytics displayed on a digital screen with various graphs charts and diagrams
  • #1506779898  Dynamic blue and green digital stock market graph with bar charts and lines on a dark background, representing financial data analysis, investment trends, business growth, and global economy fluctuat
25 50 75 100

More info

¿Cómo personalizar el fotomural para pared?

¿Qué imagen quieres?

Los fotomurales de pared permiten una personalización completa. Puedes tanto escoger un imagen tuya como cualquiera de las que te ofrecemos en nuestro banco de imágenes.

¿Tienes claras las medidas?

Puedes diseñar tu fotomural para pared como desees. A partir de los 30cm de alto y ancho, hasta los 5000cm.

Las características del material

Se trata de un vinilo fotomural polimérico con una gran calidad. Este material es rígido y está impreso con tecnología uvi; por lo que no necesita ser laminado.

¿Qué efecto buscas?

Los efectos que puedes aplicarle a tus fotomurales en pared personalizados son: 

Sin efecto.

Blanco y negro.

Sepia.

Frío.

Flip horizontal.

Flip vertical.

Rotar.

Ventajas de los fotomurales de pared

Fácil instalación (110 micras). 

Permiten decorar grandes espacios.

Disimula las imperfecciones. Sus acabados en mate permiten que las imperfecciones en la pared se disimulen.

Gran capacidad de personalización. Puedes elegir cómo estructural tu fotomural, así como las fotos que quieres obtener en tu diseño.

¿Cómo colocar el fotomural pared?

Saber colocar el fotomural pared es realmente sencillo. Con tu pedido te entregamos todos lo que necesitas para colocar el adhesivo de la mejor manera, y así conseguir los mejores resultados.

Los fotomurales son una opción ideal para todo tipo de espacios: puedes colocarlo tanto en cualquier lugar de la casa como en tu negocio. 

Mas materiales para cuadros personalizados

Info